-
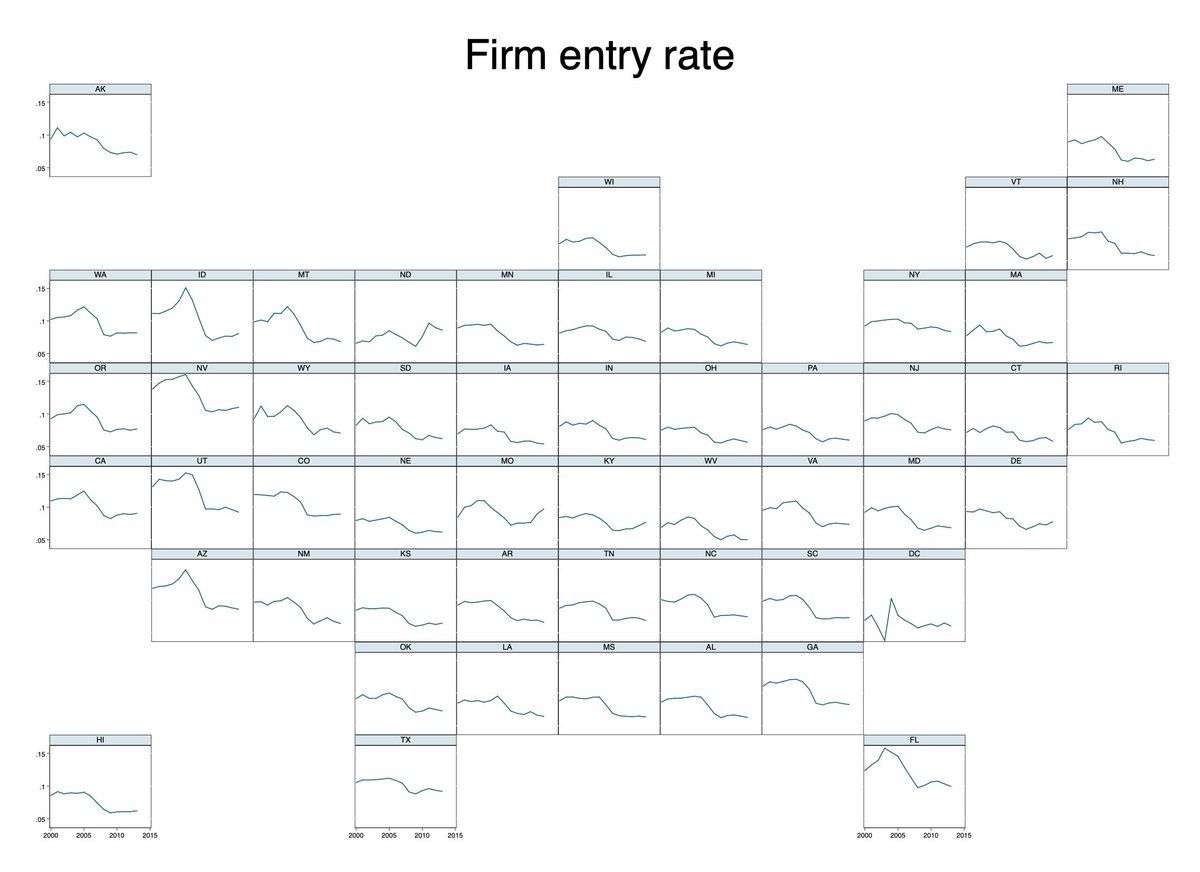
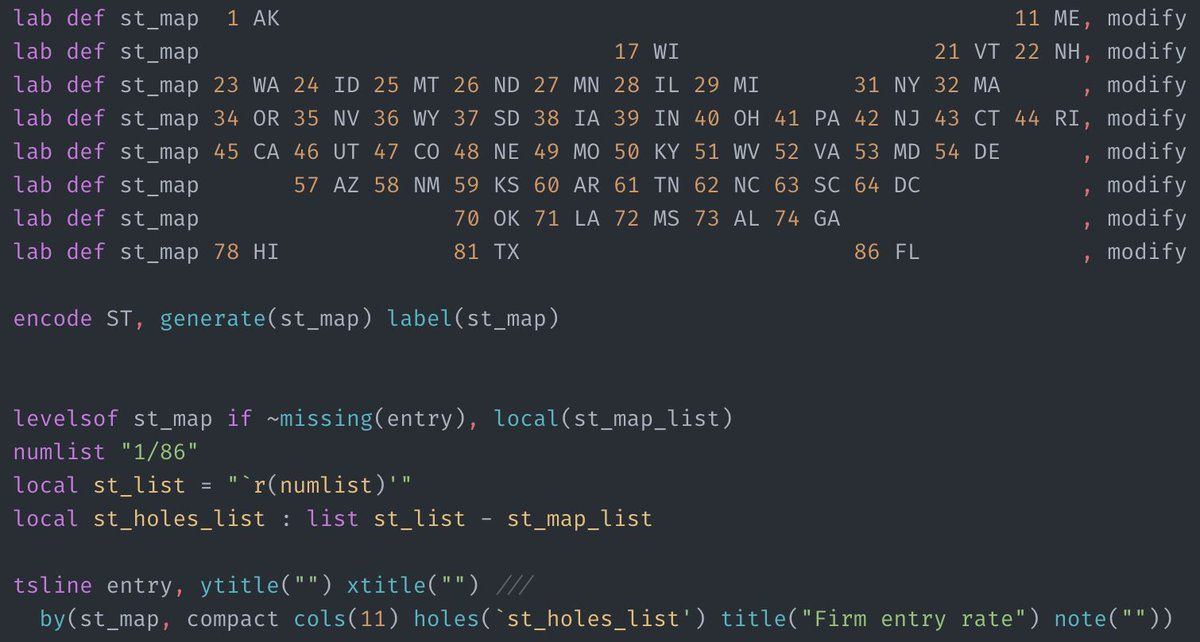
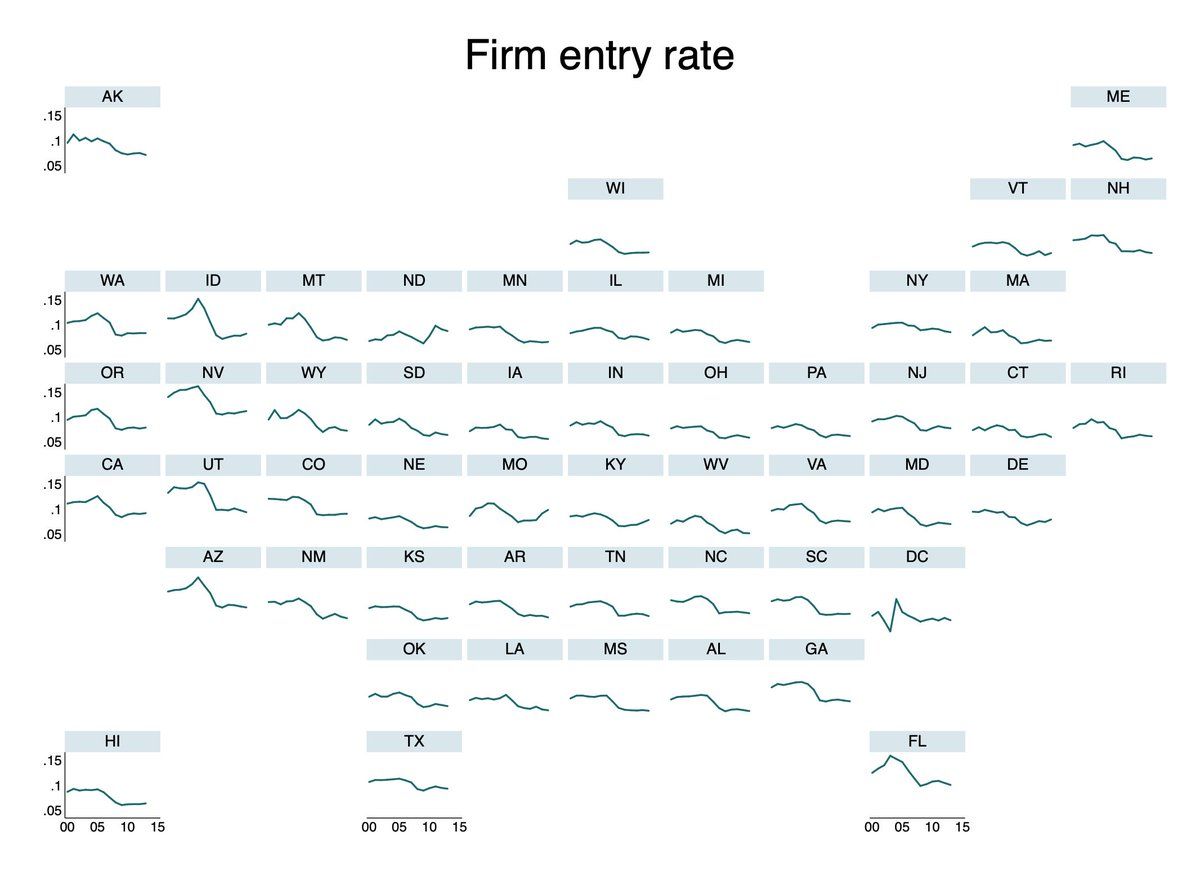
Looking at lots of state-level panel data using @Stata’s “tsline …, by(ST)” recently, and there is no reason for the states to be arranged alphabetically. So I put them on a map! Code here: gist.github.com/lukestein/af214b661158877dab08a1ad343a01b6
-
Of course, *after* coding this I discovered @JustinWolfers had done (a prettier version of) this already, and shared code on @jschwabish’s website. But my approach has some advantages (e.g., robustness to states missing data) and may be useful to someone. @JustinWolfers/872876743891333121
-
Last thing: If you *don’t* want to map the graph panels, but *do* want to sort them somehow other than alphabetically, then “egen … axis(•)” is your friend. stata.com/statalist/archive/2011-03/msg01278.html
 lukestein’s Twitter Archive—№ 2,919

